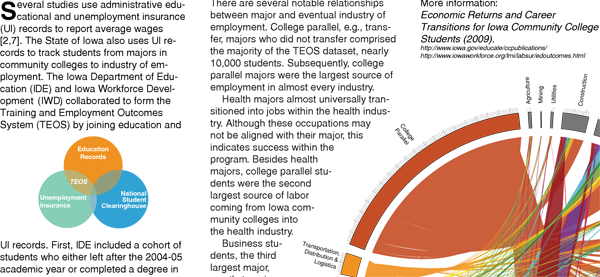
Today the Iowa Department of Education and Iowa Workforce Development released “Visualizing Transitions into the Workforce” poster. In short, DE and IWD partnered to follow students from Iowa community colleges into the workforce. The poster shows how specific majors lead to employment in various sectors in Iowa’s economy. The findings are discussed in the full poster.
The main image was created using Circos, a program originally used to map the relationship between genomes of different species. However, it’s been used recently to replace tables in general–like we did with this implementation. I think the advantages this has over a table is readily noticeable in two ways: first, it’s apparent how many college parallel (e.g., transfer) students forgo transfer and go into the workforce. Also, the relationship between health science majors and their eventual employment in the health care sector is very clear.
Circos has a built-in table viewer, but I passed on that tool and programmed in the karyotype file manually. I wrote an R script to translate the data from a pivot table to a karyotype file which I’ll post soon. Karyotype files seem more flexible for future use. For instance, we know wages for each of these students which can be overlapped on the 2-D data tracks.
Click the image above for the full PDF poster.


You might be interested to take a look at a web based flex pivot table and charts component, really cool for multidimensional data visualization – http://www.flexmonster.com