 Before leaving the Iowa Department of Education, I had the pleasure of working with Andrew Ryder on his dissertation, which studied the pathway from the GED to community college in Iowa.
Andrew spent a considerable amount of time looking for a dissertation topic. After some serious contemplation and some dead-ends, he eventually settled on the GED. He had some personal ties to the GED as his brother earned a GED before obtaining a job as an electrician. It was also relevant to current policy, where Iowa–following an initiative by Obama–adopted a goal of dramatically increasing the number of community college degrees over the next decade. Since Iowa already has relatively high educational attainment, a serious question is where these graduates going to come from. The GED program is a viable pathway, but unfortunately, the results were not good:
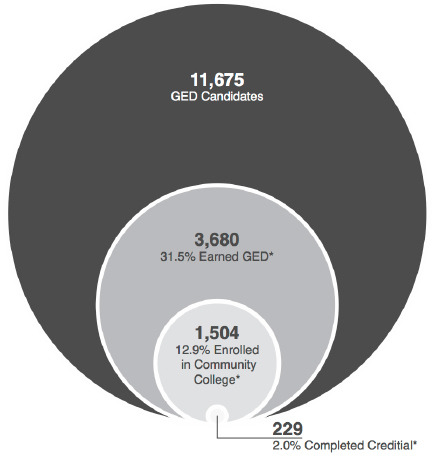
Among 11,675 Iowa high school dropouts who enrolled in the General Education Development (GED) preparation program during the 2003-04 fiscal year, fewer than a third (31.5 percent or 3,680) earned a GED by the end of the 2009 fiscal year. Just 12.9 percent of them (1,504) went on to enroll in community college, and only 2 percent (229) completed a community college credential by the end of June 2010.
Though, this may not be surprising. Prior research has suggested that the benefits of the GED are largely sheepskin. That is, the paper is providing the benefit, not necessarily the skills learned in the GED. For employers, the GED is a signal of the employees characteristics, even though that may not be the case. Behind the GED diploma, however, are people who usually have more noncognitive skills than other high school dropouts. However, there is not a large cognitive gain as a result of GED courses. Afterall, the median time to earn a GED is a little over 20 hours–how much can one really learn in that time?
The GED is not particularly strong on mathematics. The mathematics portion plateaus at geometry; hardly the rigor that college faculty are expecting from students. A newly revised GED test will, hopefully, fix those issues. From a policy perspective, the high school drop-out population is a prime target to upgrading the human capital in the United States. Unfortunately, the GED is largely ignored in contemporary education policy.
Oh, and the recently minted Doctor Ryder won the Council for the Study of Community Colleges’ “dissertation of the year” for this study. He produced the excellent graphic shown above, which highlights the excellent job he did. Careful, sometimes complex, analysis (survival analysis), applied to a pertinent policy question, with careful consideration on easily communicating the results through a single graphic.


Any references to how to produce diagram in R from data.
Not right off-hand–wasn’t done in R. Seems like you could do a bubble plot with the same x-axis and same y-axis for all bubble, then vary the size by student count.
This would be a good starting point http://flowingdata.com/2010/11/23/how-to-make-bubble-charts/