<?xml version="1.0" encoding="utf-8"?><feed xmlns="http://www.w3.org/2005/Atom" ><generator uri="https://jekyllrb.com/" version="3.10.0">Jekyll</generator><link href="https://tomschenkjr.github.io/feed.xml" rel="self" type="application/atom+xml" /><link href="https://tomschenkjr.github.io/" rel="alternate" type="text/html" /><updated>2026-05-27T19:40:17+00:00</updated><id>https://tomschenkjr.github.io/feed.xml</id><title type="html">Data, etc.</title><subtitle>The nuts and bolts from research to policy in social sciences.</subtitle><entry><title type="html">Not the time for standards in Open Data, yet</title><link href="https://tomschenkjr.github.io/blog/not-the-time-for-standards-in-open-data-yet/" rel="alternate" type="text/html" title="Not the time for standards in Open Data, yet" /><published>2016-04-10T09:57:03+00:00</published><updated>2016-04-10T09:57:03+00:00</updated><id>https://tomschenkjr.github.io/blog/not-the-time-for-standards-in-open-data-yet</id><content type="html" xml:base="https://tomschenkjr.github.io/blog/not-the-time-for-standards-in-open-data-yet/"><![CDATA[<p>It seems with the rise of a new technology, it soon follows on the discussion on how to standardize it. This is true for open data and the call for standards of key data sets where data on a particular topic would share the same schema across cities, states, counties, and countries. The promise is civic apps, which help bring data from rarefied portals to every day people, could be built-once and used-everywhere (“frictionless”). This provided a tremendous value for governments who can see the value in their work for open data. Standards on <a href="https://sites.google.com/site/housefactsdatastandard/home/city-data">building inspections</a>, <a href="http://www.yelp.com/healthscores">food inspections</a>, <a href="https://www.codeforamerica.org/specifications/trails/spec.html">parks/trails</a>, and <a href="https://openreferral.org/">social service directory</a> have been proposed.</p>

<!--more-->

<p>There is good reason to believe this can be useful. The <a href="https://developers.google.com/transit/gtfs/">GTFS </a>data standard (initially Google Transit Feed Specification then dubbed General Transit Feed Specification) unified bus and train directions that was into Google Maps and other programs. The integration made it possible to use Google Maps to get directions to a location with public transportation. But for most topics, open data standards will not provide the same benefit. While open data standards promise a better experience with apps that can easily connect to multiple portals, they will ultimately degrade the user experience for non-technical users unless some approaches to open data are fundamentally changed.</p>

<p>First, open data standards often rely on relational data models. For instance, data standards for inspections would depend on multiple tables: an inspection table, a table listing entities/business/buildings, a violation table, and so on.</p>

<figure class="align-right">
<img src="/images/hdscores-national.jpg" alt="HDScores for food inspections" width="208" height="370" />
<figcaption>HDScores for food inspections</figcaption>
</figure>

<p>But data portals do not handle relational data very well. So, as a result, a relational structure requires the first step to download or view all tables to be combined in an external program or programming language. While developers and programmers can handle those steps, it is significantly harder for non-technical users. Open Data has, rightly, been criticized for being too technical and this would not make it easier.</p>

<p>This puts user friendliness at conflict with the promise of universal, frictionless apps. The former provides immediate usefulness to a non-programmer where as the latter as a <em>promise</em> for user friendliness. Programmers though have proven to be quite adept at handling differences in schemas. Apps like <a href="http://hdscores.com/">HDScores</a>, <a href="https://github.com/open-city/look-at-cook">Look at Cook</a>, <a href="http://plenar.io/">Plenario</a>/<a href="http://opengrid.io">OpenGrid</a> (disclosure: a project I’ve led), and others are able to get around this issue.</p>

<p>Data portals need to serve multiple audiences so the format needs to be both accessible to technical and non-technical audiences. Often, that leads to a format that tries to be readable as a spreadsheet (i.e., every row is a violation) and useful for a programmer. That often results in a “flat” format that can includes a lot of columns. These are obviously not ideal, normalized schemas, but are able to strike a balance for all audiences.</p>

<p>GTFS is an excellent example for the usefulness of data standards. However, GTFS is unique since it has existed purely as a technical specification since its inception. Bus and train schedules have been readily available as maps and people did not rely on machine-readable formats. But data such as business licenses, crimes, salaries, and more have been useful in their “spreadsheet” format. Moving to a relational model for these topics would degrade the experience while gambling on the hope for user-friendly apps.</p>

<figure class="align-center">
<img src="/images/portal-vs-standard-1024x480.png" alt="Portal vs Standard comparison" width="640" height="300" />
<figcaption>Neither are perfect, but portals can serve programmers and non-technical users better than a relational schema</figcaption>
</figure>

<p>Flexible solutions, such as RDF/RDFa/schema.org have not been able to gain traction in the larger web development community, so also unlikely to gain traction in open data.</p>

<p>Finally, the development of schemas has lagged the publication of data in most cases. Working to release a standard schema requires work. For existing open data, that means conforming data to a standard, communicating with developers, and making the transition to a new schema. When facing a decision on publishing <em>more</em> data or <em>re-releasing </em>data in a different schema, I believe the movement should still focus on expanding transparency and adding more open data.</p>

<p>Of course, each one of these concerns can be addressed:</p>
<ul>
	<li>Portals could better-accommodate data standards by allowing technical users to access the relational schema through the API while providing a unified interface for non-technical users. That will help provide full technical robustness with user friendliness.</li>
	<li>Focus a few hackathons to focus the transition of existing data into data standards (a "FTFY" solution with the public)</li>
	<li>It could be easier to publish these through "off-the-shelf" ETLs. Many cities use similar programs for "big" topics like inspections, financials, 311, etc. Reducing ETL development allows for less time spent on (re)-writing ETLs to permit <em>growth</em> of portals and releasing as standards.</li>
</ul>
<p>And that’s the hope behind data standards for open data. While there are structural issues that need to be resolved before standards can take hold, there are potential solutions available that just require some work to complete. This is a partial list of concerns, but other concerns–such as definitions of items, like “violation”, are not the same across cities–are not a crucial.</p>

<p>Fortunately, there is a robust conversation on data standards for open data. I hope they can be resolved in order to advance open data.</p>

<p> </p>

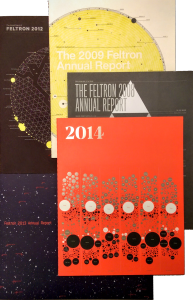
<p> </p>]]></content><author><name>Tom Schenk Jr.</name><email>tomschenkjr@gmail.com</email></author><category term="blog" /><category term="data portal" /><category term="data standards" /><category term="open data" /><summary type="html"><![CDATA[It seems with the rise of a new technology, it soon follows on the discussion on how to standardize it. This is true for open data and the call for standards of key data sets where data on a particular topic would share the same schema across cities, states, counties, and countries. The promise is civic apps, which help bring data from rarefied portals to every day people, could be built-once and used-everywhere (“frictionless”). This provided a tremendous value for governments who can see the value in their work for open data. Standards on building inspections, food inspections, parks/trails, and social service directory have been proposed.]]></summary></entry><entry><title type="html">Felton Annual Report — A Eulogy</title><link href="https://tomschenkjr.github.io/blog/felton-annual-report-a-eulogy/" rel="alternate" type="text/html" title="Felton Annual Report — A Eulogy" /><published>2016-01-24T17:44:23+00:00</published><updated>2016-01-24T17:44:23+00:00</updated><id>https://tomschenkjr.github.io/blog/felton-annual-report-a-eulogy</id><content type="html" xml:base="https://tomschenkjr.github.io/blog/felton-annual-report-a-eulogy/"><![CDATA[<p>I received the last Annual Report by <a href="http://feltron.com/">Nicholas Felton</a>. It is his 10th report in a series that began with a <a href="http://feltron.com/FAR05.html">thin volume in 2005</a>. I hesitate to say that I’ve “finally” received the report because I was not anticipating the conclusion of the series in any way. Instead, I had always looked forward to these reports, buying several copies of the sturdy, well-crafted, lithographed paper.</p>
<p style="text-align: center;"><a href="/images/feltron_report_collection.png"><img class="aligncenter size-medium wp-image-2830" src="/images/feltron_report_collection-193x300.png" alt="feltron_report_collection" width="193" height="300" /></a></p>
<p>His annual reports were quite important in my venture into data visualization. While at the Iowa Department of Education, I had the daunting task of implementing a higher pedigree of research while also explaining it to legislators, lobbyists, educators, my boss, etc. It is one thing to move quickly with data, it becomes more complicated when you everyone else must keep pace. At this point, data visualization became a serious tool to overcome this barrier.</p>

<p>The influence from Felton’s reports was rather cynical. Frankly, his reports were banal trivia about his personal life that ranged from his favorite beer to his repetitive habits. But, the reports were engaging and were incredibly interesting to peruse. It’s quite remarkable to draw in thousands of readers about someone’s life, which leads to the simple observation that I expressed to colleagues:</p>
<blockquote>Nicholas Felton is able to sell 3,000 of his reports that show his favorite beer and quirks for $30.00 a piece. We couldn't give away an education report--one of the most important topics--for free to the public. Clearly, we needed a new approach.</blockquote>
<p>Felton’s execution of the report brought the readers to attention, despite the rather personal subject matter. It seemed we–in the education community–could bring the same interest to a more weighty, significant topic of education by focusing on communication and data visualization. I sought to mimic his success, in part, by looking for inspiration in his approach.</p>

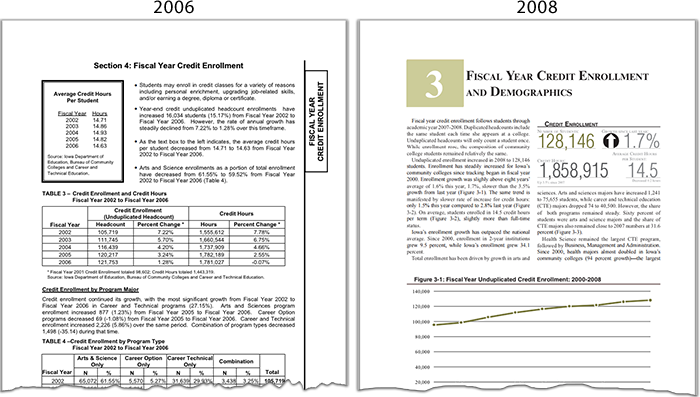
<p>Below, a comparison of two reports: <em>The Condition of Iowa Community Colleges 2006</em> and <em>The Condition of Iowa Community Colleges 2008</em>. The latter report was significantly overhauled by my team under my art direction. It incorporated several “Felton-esque” approaches: word-based infographics, call-out fonts, and a ”graphs first, no tables” approach.</p>

<p><a href="/images/comparing_condition_report_pages.png"><img class="aligncenter size-full wp-image-2714" src="/images/comparing_condition_report_pages.png" alt="comparing_condition_report_pages" width="700" height="397" /></a></p>

<p>The bullet points on the older report were replaced with large numbers, arrows, and subtle captions in 2008. Likewise, the tables in the 2006 report buried the trends that many people were looking for. On the right, you can see the direction of enrollment and whether it is steady or sharply changing.</p>

<p>In addition, while data visualization was a key part, it’s hard to escape that good design principles also needed to be included: a high-quality, efficient font, respect for white space, and a pleasing, sensible color palette. This design-first approach let us add more narrative while also reducing the pages. The improved layout helped improve readability as well.</p>

<p>Felton’s annual reports were a key influence for me and helped our team engage better with stakeholders. While I look forward to his future work, his annual innovations will be sorely missed.</p>]]></content><author><name>Tom Schenk Jr.</name><email>tomschenkjr@gmail.com</email></author><category term="blog" /><category term="Data Visualization" /><category term="iowa" /><category term="Nicholas Felton" /><summary type="html"><![CDATA[I received the last Annual Report by Nicholas Felton. It is his 10th report in a series that began with a thin volume in 2005. I hesitate to say that I’ve “finally” received the report because I was not anticipating the conclusion of the series in any way. Instead, I had always looked forward to these reports, buying several copies of the sturdy, well-crafted, lithographed paper. His annual reports were quite important in my venture into data visualization. While at the Iowa Department of Education, I had the daunting task of implementing a higher pedigree of research while also explaining it to legislators, lobbyists, educators, my boss, etc. It is one thing to move quickly with data, it becomes more complicated when you everyone else must keep pace. At this point, data visualization became a serious tool to overcome this barrier.]]></summary></entry><entry><title type="html">Big Data and Big Cities</title><link href="https://tomschenkjr.github.io/blog/big-data-and-big-cities/" rel="alternate" type="text/html" title="Big Data and Big Cities" /><published>2016-01-05T17:48:30+00:00</published><updated>2016-01-05T17:48:30+00:00</updated><id>https://tomschenkjr.github.io/blog/big-data-and-big-cities</id><content type="html" xml:base="https://tomschenkjr.github.io/blog/big-data-and-big-cities/"><![CDATA[<p>Naturally, a paper titled <a href="http://people.hbs.edu/mluca/BigDataBigCities.pdf"><em>Big Data and Big Cities: The Promise and Limitations of Improved Measures of Urban Life</em></a> piqued my interest. From the discussion, of <a href="https://www.thalesgroup.com/en/worldwide/big-data/four-vs-big-data">“big data” four V’s</a>, Glaeser et al. focused on large volumes of data. The paper discussed two types of big data: while researchers typically used aggregated data, such as totals by ZIP codes derived from Census surveys, one dimension of “big data” comes via administrative data sources such as individual IRS tax returns. The other type of source is from public, social media sources like Facebook, Twitter, and Google Streetview.</p>

<p>There is something rather quixotic about arguing over the definition of <a href="https://www.perceptualedge.com/blog/?p=1349">big data to the point of being unhelpful</a>, so I want to leave that aside and focus on the author’s arguments. In this case, it’s helpful to peel back the onion to understand what Glaeser et al. see as the potential virtue of their definition of big data and what it cannot do. Here, the authors make their most important thesis statement:</p>
<blockquote>
<p class="p1">...big data on its own establishes only correlation—not causality. Even if the data show that urbanites walk more and that people who walk more are healthier, we cannot interpret this as meaning that walking causes health generally or the healthy of urbanites in particular. We would need some alternative source of variation.</p>
</blockquote>
<p>“Big data”, in this context, though isn’t sufficient to determine the causality that’s typically interesting for policy analysis. In this context, “big data” and treating it as a panacea can be equally dangerous. In Kenneth Cukier and Viktor Mayer-Schönberger’s <a href="http://www.amazon.com/Big-Data-Revolution-Transform-Think/dp/0544227751"><em>Big Data: A Revolution That Will Transform How We Live, Work, and Think</em></a>, they ambitiously and incorrectly suggest that correlations within big data are enough to determine causation. But this type of big data is observational, so the endogenous factors that lead to things, like segregation, are problematic.</p>

<p>This is fundamental statistics and unfortunately getting lost in the “big data” discussions. It is still necessary that data reflect the populations or groups you are trying to understand. Social media data, for instance, is a great tool to study younger users, technically literate users regardless of age, or of course, to study social media users. However, that data is not a useful measure of older populations, those without internet connections, or Luddites. “Big data” does not solve this problem, no more than traditional surveys.</p>

<p>But, a large volume of data does have its benefits. One benefit of “big data” is the ability to eschew and sacrifice a large number of observations for pseudo-experimental methods. In one vivid example outlined by Glaeser et al. is suppose, for instance, we want to estimate the willingness-to-pay for a park. Typically, this would be done by comparing aggregations from ZIP codes or other large geography. But this is misleading since ZIP codes are not going to be similar. As a whole, ZIP codes have distinct characteristics. Even better, comparing records of housing which are across the street is a far better.</p>

<p>With “big data”, it’s possible to do this sort of comparison for at least two reasons: first, the individual-level observations let researchers match homes. Second, presumably, millions of observations gives researchers enough robustness to derive estimates. Interestingly, it’s unlikely <em>all</em> of the data will be used. A large share of it will likely be disregarded. When starting with millions of observations, there is plenty to lose and still retain robust estimates.</p>

<p>Big data is “cheap”, in the sense that millions of observations can be ignored. In the above example–where we’re interested in measuring willingness-to-pay for parks–we are only interested in matching homes that are next to the park. Thousands of homes, though, aren’t relevant to this analysis and can be removed from the observations. When using survey or smaller data samples, researchers often find themselves desperately trying to keep any viable observations at the risk of hurting the robustness of the statistical models.</p>

<hr />

<p>The authors, though, seem to slip into some fundamental understanding–big data versus a system to record data. In a particularly confusing paragraph, Glasear <em>et al.</em> notes “big data makes it easier to have systems for citizen complaints that enable citizens and public monitors to monitor progress”. Of course, this is a reference to 311 systems–a generator of big data, not an enabler of residential complaints. This is where, clearly, big data is be pointed and confused with other technology.</p>

<p>Unfortunately, the authors also seem to fall into their own trapping of “big data”. The authors suggest that LinkedIn data be used to measure job search habits. This is helpful, but limited because of selection-bias. LinkedIn applications are likely white-collar job seekers, not construction workers or other industries that tend to be more tied to the business cycle. The value of this data is limited because it’s audience–although voluminous and complex–is endogenous to other factors which undermine the analysis.</p>

<p>As typical, the end of the paper wrapped-up with further suggestions on how big data can be useful for cities. For instance, the authors mention the use of data to predict food inspections has been done in Chicago, Boston–which is referenced in the paper–and other locations. But, it seems to miss the nuance of the challenges facing cities. Another proposal–using police records to predict recidivism–has been widely discussed. At this point, the idea is not new but work needs to be finished on the ethical and practical implications.</p>

<p>Besides the obvious ethical implications, there are practical issues as well. In Chicago, a shooting victim was notified about his <a href="http://articles.chicagotribune.com/2013-08-21/news/ct-met-heat-list-20130821_1_chicago-police-commander-andrew-papachristos-heat-list">presence on a “heat list”</a>–a likely shooting victim. Within two weeks, he was dead. The practical question on how to intervene is more crucial than the statistical exercise at this point. However, these is plenty of opportunity, in this respect, to judge which interventions help avoid recidivism.</p>

<hr />

<p>In some respects, the authors are implying that big data can let you be lazy. Instead of designing careful surveys, there is a world of data available for the taking. Of course, this is a bit harsh. Surveys are also expensive and there is<a href="http://fivethirtyeight.com/features/is-the-polling-industry-in-stasis-or-in-crisis/"> evidence that people are avoiding responding to them</a>. But the ubiquitous nature of these data sources has another advantage: automation.</p>

<p>In a lovely example, the authors show how images from Google Street View could be used to predict household incomes. The authors took data from New York City and created a computer vision model to create descriptors of a buildings geometry, color, and other attributes to predict household incomes at a Census block-group. The variables did well and seemed to be a feasible way to estimate this data.</p>

<p>The practical improvement on this approach is it can be done annually. Typically, Google Street View is updated once-a-year in big cities. While the timing of the images is important and left alone in this paper, it is a practical method to boost American Community Surveys, which are not widely available at granular levels on an annual basis. Moreover, this types of approaches can be used each year, providing a more regular stream of feedback to community planners.</p>]]></content><author><name>Tom Schenk Jr.</name><email>tomschenkjr@gmail.com</email></author><category term="blog" /><category term="big data" /><category term="data science" /><category term="research" /><category term="urban" /><summary type="html"><![CDATA[Naturally, a paper titled Big Data and Big Cities: The Promise and Limitations of Improved Measures of Urban Life piqued my interest. From the discussion, of “big data” four V’s, Glaeser et al. focused on large volumes of data. The paper discussed two types of big data: while researchers typically used aggregated data, such as totals by ZIP codes derived from Census surveys, one dimension of “big data” comes via administrative data sources such as individual IRS tax returns. The other type of source is from public, social media sources like Facebook, Twitter, and Google Streetview.]]></summary></entry><entry><title type="html">What to post on open data portals? Let me Google, er, Bing that for you.</title><link href="https://tomschenkjr.github.io/blog/what-to-post-on-open-data-portals-let-me-google-er-bing-that-for-you/" rel="alternate" type="text/html" title="What to post on open data portals? Let me Google, er, Bing that for you." /><published>2015-08-24T06:25:59+00:00</published><updated>2015-08-24T06:25:59+00:00</updated><id>https://tomschenkjr.github.io/blog/what-to-post-on-open-data-portals-let-me-google-er-bing-that-for-you</id><content type="html" xml:base="https://tomschenkjr.github.io/blog/what-to-post-on-open-data-portals-let-me-google-er-bing-that-for-you/"><![CDATA[<p>Quick wins. An entire post–nay, novel–could be written about the life of quick wins. For data portals, quick wins are important. I’ve talked to a number of cities who have a fresh data portal and they wonder what should be posted first so they can get the quick wins needed to prove the data portal adds values. Generally, I hit some initial areas:</p>
<ul>
	<li>Anything that is currently posted as a PDF</li>
	<li>Frequently FOIA'd data -- which helps the public and also saves staff time</li>
	<li>Anything that is currently posted as an Excel or CSV</li>
</ul>
<p>The first two follow a different work path. For the last item, there is a great free, open-source tool which helps you identify Excel and other documents currently posted to a government website. <a href="http://lmgtdfy.usopendata.org/"><strong>L</strong>et <strong>M</strong>e <strong>G</strong>et <strong>T</strong>hat <strong>D</strong>ata <strong>F</strong>or <strong>Y</strong>ou</a> (lmgtdfy) leverages Microsoft Bing to find Excel, JSON, comma-separated (CSV), Shapefiles, and other documents that could be posted to the data portal.</p>

<p>Visit the website to enter a URL,  which scans all the websites (the entire domain) and subdomains for the applicable file types. You can browse the results to see if there are any files currently posted that can be posted on the portal. Below, a scan of <em>www.cityofchicago.org</em> shows some results. After further inspection, many of these files are “forms” in Excel and not a good fit for the open data portal. However, there are some promising leads for our team.</p>

<p><a href="/images/Screen-Shot-2015-08-24-at-7.16.00-AM.png"><img class="aligncenter size-large wp-image-2373" src="/images/Screen-Shot-2015-08-24-at-7.16.00-AM-1024x615.png" alt="lmgtdfy" width="640" height="384" /></a></p>

<p>This also a useful on-going strategy for mature data portals. Sometimes, data gets posted to a website without talking to the open data portal team. <em>C’est la vie</em>. Check this quarterly to try to capture any of these “mistakes”.</p>

<p>Careful, though, if you already have a data portal. lmgtdfy will return the results from the portal as well. So, Excel and CSV files available on your <em>data.city.gov </em>(data portals are often on a subdomain) will also show up. To avoid this, enter <em>www.city.gov</em> to avoid those results.</p>

<p>This strategy has some limitations. The primary mission of open data is to provide data in a machine-readable format, and Excel documents do qualify as machine readable. To that extent, it’s a relatively small win. But it does help you consolidate your data onto a data portal instead of documents across a sprawling government site. Portals also provide a quick way for users to visualize data–instead of opening in Excel–or for programmers to use an API.</p>

<p>lmgtdfy is a good way to get the quick wins to get data onto the data portal. Combine it with some other strategies and one or two big items in the early months to get a big win.</p>]]></content><author><name>Tom Schenk Jr.</name><email>tomschenkjr@gmail.com</email></author><category term="blog" /><category term="data portal" /><category term="lmgtdfy" /><category term="open data" /><summary type="html"><![CDATA[Quick wins. An entire post–nay, novel–could be written about the life of quick wins. For data portals, quick wins are important. I’ve talked to a number of cities who have a fresh data portal and they wonder what should be posted first so they can get the quick wins needed to prove the data portal adds values. Generally, I hit some initial areas: Anything that is currently posted as a PDF Frequently FOIA'd data -- which helps the public and also saves staff time Anything that is currently posted as an Excel or CSV The first two follow a different work path. For the last item, there is a great free, open-source tool which helps you identify Excel and other documents currently posted to a government website. Let Me Get That Data For You (lmgtdfy) leverages Microsoft Bing to find Excel, JSON, comma-separated (CSV), Shapefiles, and other documents that could be posted to the data portal.]]></summary></entry><entry><title type="html">Open data as consumer protection</title><link href="https://tomschenkjr.github.io/blog/open-data-as-consumer-protection/" rel="alternate" type="text/html" title="Open data as consumer protection" /><published>2015-06-06T11:18:30+00:00</published><updated>2015-06-06T11:18:30+00:00</updated><id>https://tomschenkjr.github.io/blog/open-data-as-consumer-protection</id><content type="html" xml:base="https://tomschenkjr.github.io/blog/open-data-as-consumer-protection/"><![CDATA[<figure class="align-center">
<a href="/images/16238710257_daaadfeefe_k.jpg"><img src="/images/16238710257_daaadfeefe_k-1024x682.jpg" alt="Taxi cab" width="640" height="426" /></a>
<figcaption>Courtesy of Scott L. Licensed under Attribution-ShareAlike 2.0 Generic (CC BY-SA 2.0)</figcaption>
</figure>

<p>Open data has a number of uses: transparency, economic development, galvanizing technology, and also consumer protection. A recent experience crystalized this fact. Super Bowl 49 was a messy day in Chicago. By the time the game ended, 16” of snow had accumulated on the ground, and would still fall throughout the night. A hard, gusty wind sandblasted snow against your face. Needless to say, it was unpleasant to be outside.</p>

<p>The blizzard and conclusion of the game created a high demand for cabs and rideshares were high. Uber surcharge was at least 2.5x at the time and was treacherous for the cabs who decided to venture out. But, while demand is high, it’s not the opportunity to gouge customers. Rideshare programs are allowed to surcharge, but otherwise, provide their services at a lower cost. Taxi cabs, however, provide their services at a fixed cost at all times with clear rules displayed to riders and are allowed to pick up passengers from the sidewalks around the city. Violating this can be reported through the city’s 311 system.</p>

<p>While trying to get a cab, the driver pulled over and asked where I was heading. He responded with “$15”–about twice the price I would normally pay for the trip. I declined but attempted to mentally note the medallion number on the cab and started the 1-mile trek home. Unfortunately, I had forgotten the medallion number after 20 minutes in a blizzard, knee-high drifts, and sandblasting snow. I could only vaguely recall the first couple of digits.</p>

<p>I have seen a number of cab drivers conduct activities that were technically prohibited. I’ve ignored most of them, but attempting to garner higher fares during a blizzard was abusing the situation. While I declined the trip (knowing it was illegal), I would hate to see someone else paid twice the legal amount.</p>
<div>
<p style="margin-bottom: 3px;"><a style="font-size: 12px; font-weight: bold; text-decoration: none; color: #333333; font-family: arial;" href="https://data.cityofchicago.org/Community-Economic-Development/Public-Passenger-Vehicle-Licenses-Taxis-Only/gcze-gasw" target="_blank">Public Passenger Vehicle Licenses - Taxis Only</a></p>
<iframe title="Public Passenger Vehicle Licenses - Taxis Only" src="https://data.cityofchicago.org/w/gcze-gasw/3q3f-6823?cur=wyApiuVMekd&amp;from=root" width="640px" height="425px" frameborder="0" scrolling="no"><a href="https://data.cityofchicago.org/Community-Economic-Development/Public-Passenger-Vehicle-Licenses-Taxis-Only/gcze-gasw" title="Public Passenger Vehicle Licenses - Taxis Only" target="_blank">Public Passenger Vehicle Licenses - Taxis Only</a></iframe>

</div>
<p>The open data portal contains a list of all authorized cab vehicles. While I partly remembered the medallion, I vividly recall the cab being a blue and white Ford Escape. The medallion number, description of the vehicle, and the operating company are all available on the portal. I sorted the medallion numbers, looking at the 159- and 157- numbers, then looked at the vehicle description. <a href="https://data.cityofchicago.org/Community-Economic-Development/Active-Taxi-Vehicle-Models-Graph/hemf-zffe">Toyota Camry</a> is the most popular cab model in Chicago, so it was easy to spot the blue and white Escape in the list.</p>

<p>Once I had that information, I was able to complete an online <a href="https://servicerequest.cityofchicago.org">311 form</a> to report the issue. The city kept me informed on the progress, making sure the occasional driver who violates the rules are reprimanded. Open data was used to help that process.</p>

<p> </p>]]></content><author><name>Tom Schenk Jr.</name><email>tomschenkjr@gmail.com</email></author><category term="blog" /><category term="data portal" /><category term="open data" /><category term="open gov" /><category term="open government" /><category term="opendata" /><category term="opengov" /><summary type="html"><![CDATA[Courtesy of Scott L. Licensed under Attribution-ShareAlike 2.0 Generic (CC BY-SA 2.0)]]></summary></entry><entry><title type="html">Tools are not to blame, blame laziness</title><link href="https://tomschenkjr.github.io/blog/tools-are-not-to-blame-blame-laziness/" rel="alternate" type="text/html" title="Tools are not to blame, blame laziness" /><published>2015-05-16T20:30:21+00:00</published><updated>2015-05-16T20:30:21+00:00</updated><id>https://tomschenkjr.github.io/blog/tools-are-not-to-blame-blame-laziness</id><content type="html" xml:base="https://tomschenkjr.github.io/blog/tools-are-not-to-blame-blame-laziness/"><![CDATA[<p>PowerPoint and Excel aren’t the enemy, though a lot of people to seem to think they are. Frequently, I hear others say “don’t use PowerPoint” or snicker when someone mentions conducting analysis with Excel. This is wrong. There is nothing wrong with Excel or PowerPoint; I am a fan and user of both programs. The problem is the creativity and capability of those using those programs and it’s time to realize that.</p>

<figure class="align-center">
<a href="/images/US_Navy_040605-N-6633C-002_Commander_Naval_Reserve_Force_Vice_Adm._John_G._Cotton_is_silhouetted_in_front_of_a_Powerpoint_slide_mapping_out_the_Naval_Reserve_Forces_future.jpg"><img src="/images/US_Navy_040605-N-6633C-002_Commander_Naval_Reserve_Force_Vice_Adm._John_G._Cotton_is_silhouetted_in_front_of_a_Powerpoint_slide_mapping_out_the_Naval_Reserve_Forces_future-1024x748.jpg" alt="There is a problem here, but it's not the tool." width="640" height="467" /></a>
<figcaption>There is a problem here, but it's not the software.</figcaption>
</figure>

<p>A number of speakers urge people to stop using Excel (with a haughty, better-than-thou approach) and move to more advanced software like <a href="http://r-project.org">R</a>. But there are a number of reasons why switching from Excel to R or Python as the primary analytic tool is a terrible idea: it requires a steep learning curve that can delay projects. Likewise, it’s easy to blame PowerPoint, but PowerPoint’s fault is being the predominate presentation software. It is as easy to create terrible presentations in Keynote, Google Docs, and doubly-so for <a href="http://en.wikipedia.org/wiki/Beamer_%28LaTeX%29">Beamer</a>. But PowerPoint is one of the best tools for creating presentations: it’s powerful, prevalent, and familiar to users.</p>

<p>The problem is how users approach the software, attempting to fill-in the pre-formatted bullet points. PowerPoint is a blank canvas with robust ability to add shapes, images, text with a quick ability to organize, layer, and animate each element. Likewise, the default Excel graphs can be improved as well, but simply requires the user to think outside the default. R, Python, and any other high-power language gives you a completely blank canvas, which requires you to fill in all the blanks. Excel and PowerPoint give you a template, users just need to break through to get to better outcomes.</p>

<figure class="align-center">
<a href="/images/powerpoint-two-ways.png"><img src="/images/powerpoint-two-ways-1024x450.png" alt="Left: Default PowerPoint template encourages poor practice. Right: Viewing PowerPoint as a blank canvas for display shapes, objects, and media is the best practice." width="640" height="281" /></a>
<figcaption>Left: Default PowerPoint template encourages poor practice. Right: Viewing PowerPoint as a blank canvas for display shapes, objects, and media is the best practice.</figcaption>
</figure>

<p>Often, headlines rail against PowerPoint and the culture it propagates. Unfortunately, most people only take the headline home. Edward Tufte is a well-known anti-PowerPoint author, leading to dramatic headlines (not unlike my own) that PowerPoint is bad. But his point is more subtle, railing against the lazy culture of throwing slides against a wall with no preparation.</p>
<blockquote>Replacing PowerPoint with Microsoft Word [...] will make presentations and their audiences smarter. Of course full-screen projected images and videos are necessary; that is the one harmless use of [PowerPoint]. Meetings should center on concisely written reports on paper, not fragmented bulleted talking points projected up on the wall.</blockquote>
<p>That is, there are appropriate and inappropriate use of PowerPoint–something true of almost every software. Thus, it’s the imagination and use of PowerPoint–not the tool itself–which creates the issue.</p>
<h2>Breaking through defaults</h2>
<p>Users need to be trained to view PowerPoint different, to view it as an empty canvas in which to communicate with others. Failure to create a compelling presentation is often a failure of the author, not the tool. In my own experience, the largest hurdles are creating sensible animations and the inability to quickly embed YouTube or other videos.</p>

<p>Even for visualization, Excel is a fantastic tool. I see as much chart junk on ggplot2–though I love ggplot2–as Excel, but both can be easily cleaned-up.</p>

<p><a href="/images/Screen-Shot-2015-03-29-at-11.46.58-PM.png"><img class="aligncenter size-full wp-image-2115" src="/images/Screen-Shot-2015-03-29-at-11.46.58-PM.png" alt="Default versus Modified Excel" width="720" height="220" /></a></p>

<p>Do-ers, who I appreciate more than thinkers, have given practical advice for data visualization in Excel. Juice Analytics has a wonderful <a href="http://labs.juiceanalytics.com/chartchooser/index.html">chart chooser tool</a>, which provides clean, minimalist Excel chart templates. <a href="http://stephanieevergreen.com/">Stephanie Evergreen</a>, a data visualization consultant, has provided lectures and workshops that primarily focus on Excel visualizations. Whether Tufte, Few, or others, the groundbreaking visualizations created by leaders in the field can be replicated in Excel if you’re willing to change the defaults.</p>
<h2>Think about the objective, not the tool</h2>
<p>Snickering at Excel and PowerPoint has a real, substantial side effect. People who use these programs develop inferiority complex about knowing these programs, seeking out to only do analysis with R and other more complex tools. It’s always good to seek new knowledge and challenging yourself, but this can also be misguided. It’s important to think about the objective, then to think about the best tool to achieve it.</p>

<p>Any tool is never a pancea for everything, trade-offs always exist, so it’s important to see when Excel fails to do a good job. A rule of thumb I follow is this: avoid Excel if you’re going to have to repeat your analysis. Projects which require multiple steps in computation–such as summing rows, then summing columns, or other steps–are very hard to quickly reproduce unless you are replacing data of equal rows and columns each time. Repeating complicated analysis is not only hard on the user, but susceptible to error that can’t be easily detected. R, Python, and other scripting tools can be written once and repeated always–but that scripting can take longer.</p>

<p>PowerPoint–even when it’s executed well–is not always the right tool. Sometimes it’s more appropriate to circulate a report, one-pager, or use another medium. For that, you need to judge how you want to <em>communicate </em>with your audience, not only thinking about which tool you want to use. Consider how your audience may want to consume that information and the best way to maximize their involvement. Consider your goals: is the mission to get them hooked? To provide a just brief overview? To galvanize support? To engage them deeply on a topic? Each one of these may have a different approach, where PowerPoint may or may not be appropriate.</p>]]></content><author><name>Tom Schenk Jr.</name><email>tomschenkjr@gmail.com</email></author><category term="blog" /><category term="Data Visualization" /><category term="Excel" /><category term="PowerPoint" /><summary type="html"><![CDATA[PowerPoint and Excel aren’t the enemy, though a lot of people to seem to think they are. Frequently, I hear others say “don’t use PowerPoint” or snicker when someone mentions conducting analysis with Excel. This is wrong. There is nothing wrong with Excel or PowerPoint; I am a fan and user of both programs. The problem is the creativity and capability of those using those programs and it’s time to realize that.]]></summary></entry><entry><title type="html">Data portals are tomorrow’s map room</title><link href="https://tomschenkjr.github.io/blog/data-portals-are-tomorrows-map-room/" rel="alternate" type="text/html" title="Data portals are tomorrow’s map room" /><published>2015-02-15T23:41:23+00:00</published><updated>2015-02-15T23:41:23+00:00</updated><id>https://tomschenkjr.github.io/blog/data-portals-are-tomorrows-map-room</id><content type="html" xml:base="https://tomschenkjr.github.io/blog/data-portals-are-tomorrows-map-room/"><![CDATA[<p>I’ve often found myself exploring a library’s map room or thumbing through old Census records while taking study breaks. I was often surprised how I could become engrossed with old data. Some of the fascination comes from a historical narrative of history from the perspective of that generations point-of-view, even if it was based on faulty logic or data that would be later crystalized. With the advent of open data, digital maps, and databases, how will we be able to explore historical data in the future; that is, how can we look at today’s data over the next 20 years?</p>

<figure class="align-center">
<img src="/images/books-164530_1280-1024x613.jpg" alt="Old Books" width="640" height="383" />
<figcaption>They lack machine-readability, but they do have longevity</figcaption>
</figure>

<p>The paradox is paper documents are not easily accessible and shunned by the open data community, but paper has proven to be one of the most accessible formats across generations while digital formats are frequently deprecated and takes a higher level of expertise to open. As a result, today’s open data portals provide up-to-date, machine-readable data, but how will this impact the next generation who wants to read the same data?</p>

<p>Open data portals will be the proverbial map room for the next generation. Have we done well enough to preserve this data for tomorrow’s investigators of history? Often, the process on updating today’s data portals are not tuned to long-term preservation. For instance, maps are updated frequently, but often, updated information is simply overwritten historical data. Even tabular data may be rewritten with the most recent information and older data, even if inaccurate, is lost to the digital recycle bin. Immediately updating information is very useful for contemporary purposes such as transparency and app development. What are the ramifications of this process for the next generation, who will rely on this digital data and not paper-based maps?</p>
<p style="text-align: center;"><iframe src="http://emp.bbc.co.uk/emp/embed/smpEmbed.html?playlist=http%3A%2F%2Fplaylists.bbc.co.uk%2Fnews%2Fscience-environment-31458902A%2Fplaylist.sxml&amp;title=Net%20pioneer%20warns%20of%20digital%20'Dark%20Age'&amp;product=news" width="400" height="500" frameborder="0"></iframe></p>
<p>Maintaining historical data is one thing, but we need to be mindful of providing formats that can be opened by future users. Vint Cerf <a href="http://www.bbc.com/news/science-environment-31450389">recently noted</a> an internet “dark age”, where today’s memories, data, and pictures won’t be accessible to future generations. This is also true for open data, where today’s maps and data are not guaranteed to last or be easily accessible for tomorrow. While it’s possible to convert file formats, this requires more expertise by the end-users, potentially dissuading future researchers. Moreover, what happens when portals grow, transform, and change? It seems likely that data may be eventually purged and deleted – essentially the same problem of the lost floppy disks of data from the 1990s.</p>

<p>Chicago’s open data team has identified this concern as well, beginning to take some limited measures to counteract these problems. Most notably, we instituted some limited version control of maps. New maps aren’t overwritten, but deprecated. Take, for example, uploads of the city’s Street Center Line data that shows the location of all Chicago’s roads. Deprecated files allow those interested in older data to see how Chicago’s roads have grown and changed over the years.</p>

<p><a href="/images/Screen-Shot-2015-02-15-at-11.00.38-PM.png"><img class="aligncenter size-full wp-image-1992" src="/images/Screen-Shot-2015-02-15-at-11.00.38-PM.png" alt="Deprecating Street Center Line data" width="629" height="270" /></a></p>

<p>Yet, this isn’t a tenable solution. This process works on a limited basis, but would not work on data that changes frequently.</p>

<p>Libraries themselves may be able to provide the most help on this problem. Libraries have been experts on preservation for decades, which has also extended to digital preservation, such as the <a href="http://www.lib.uchicago.edu/e/collections/maps/chi1890/">University of Chicago’s digitization of old maps</a>. Digital preservation for already-digital data is a different practice. This practice requires frequently changing data to be captured. <a href="http://en.wikipedia.org/wiki/Internet_Archive">Internet Archive’s</a> <a href="http://en.wikipedia.org/wiki/Wayback_Machine">Wayback Machine</a> accomplishes this by preserving websites over time, but archiving open data needs to preserve the data formats and any links directed to metadata.</p>

<p>This topic deserves far more conversation, but here are some initial thoughts on how to counteract these issues:</p>
<ul>
	<li>Use open formats that are more likely to evolve as they are less dependent on companies that drive proprietary formats. Open formats are more likely to have conversion tools.</li>
	<li>Libraries have been the preservationists for generations. We can adopt those practices for digital preservation, working with libraries to develop practices that preserve digital data.</li>
	<li>Encourage greater version control of open data. While some practices can be adopted (see above), these are kluge and will be difficult to manage over decades.</li>
	<li>Reduce the practice of overwriting data, making a dataset a historical and contemporary records.</li>
</ul>
<p>Digital preservation is one of the items that needs to be addressed as data portals mature. For now, time is a little on our side, but not for much longer.</p>]]></content><author><name>Tom Schenk Jr.</name><email>tomschenkjr@gmail.com</email></author><category term="blog" /><category term="digital preservation" /><category term="open data" /><summary type="html"><![CDATA[I’ve often found myself exploring a library’s map room or thumbing through old Census records while taking study breaks. I was often surprised how I could become engrossed with old data. Some of the fascination comes from a historical narrative of history from the perspective of that generations point-of-view, even if it was based on faulty logic or data that would be later crystalized. With the advent of open data, digital maps, and databases, how will we be able to explore historical data in the future; that is, how can we look at today’s data over the next 20 years?]]></summary></entry><entry><title type="html">CDO as business development: Some notes from experience</title><link href="https://tomschenkjr.github.io/blog/cdo-as-business-development-some-notes-from-experience/" rel="alternate" type="text/html" title="CDO as business development: Some notes from experience" /><published>2015-01-18T15:12:15+00:00</published><updated>2015-01-18T15:12:15+00:00</updated><id>https://tomschenkjr.github.io/blog/cdo-as-business-development-some-notes-from-experience</id><content type="html" xml:base="https://tomschenkjr.github.io/blog/cdo-as-business-development-some-notes-from-experience/"><![CDATA[<p>Luke Fretwell posted an<a href="http://govfresh.com/2015/01/chief-data-officer-business-developer/"> interesting article</a> on the role CDO has as a business development officer:</p>
<blockquote>If I was a Chief Data Officer [...] I would also proactively reach out to these companies to find out what data they’re interested in that government might be able to provide. This could help determine data release schedule/priority or expose low-hanging fruit opportunities and leverage quick wins. Having an established demand also makes it easier to convince internal stakeholders of the value and gives them an incentive to be more proactive in opening the data they manage.</blockquote>
<p>Business is one of the key areas targeted by portals. In addition to transparency, promoting civic development, and research, open data as a business development tool has become a more frequent target of open data initiative. The <a href="http://www.mckinsey.com/insights/business_technology/open_data_unlocking_innovation_and_performance_with_liquid_information">McKinsey report on open data</a>, despite its misgivings, acutely noted the role that opening weather and GPS data had on creating new products in the economy. Like all constituents, requests from start-ups does help gauge the interesting datasets</p>

<p>I do frequently reach out to businesses to see how open data can help, ranging from start-ups to more established companies. This includes start-ups in Chicago, reaching out to start-ups who have released apps based on open data in other cities, and large companies. Reaching-out to local start-ups helps achieve a pair of goals: expanding the use of open data and supporting the local start-up economy. It is relatively easy to reach out to these start-ups, find them in incubators, see them at <a href="http://opengovhacknight.org/">OpenGov Hack Night</a>, and visiting entrepreneurship courses in MBA programs are some of the key actions. A network of supporting characters, such as Smart Chicago Collaborative, helps keep us connected to potential companies.</p>

<p>Likewise, it has been important to reach out to companies that have released products based on open data in other cities. If we can’t be the first city rolling out with an application, we want to be the second. We’ll actively reach out to these companies and make sure they’re aware of our portal, make sure they’re aware we have similar data, and ask if we can help in case we don’t have that data or there are questions about it (this is when good metadata can really matter). While I cannot point to anything that has launched yet, I’m looking forward to some new services that may be launched in the city due to this effort.</p>

<p>Nevertheless, some interesting challenges started to rise. While working with one large mapping company, we were making an effort to provide some of our maps that could be used in an application. We noted many maps were released using the very permissive MIT license. This license seemed to be the best poised to include in a commercial application. However, the following clause created an issue: “<span style="color: #494949;">The above copyright notice and this permission notice shall be included in </span><span style="color: #494949;">all copies or substantial portions of the Software.”</span></p>

<p>The application development team was unsure if such a clause could be included in the license. This was a bit of an impasse, but these challenges will pop-up that requires everyone to adjust. So, while including terms of open source licensing has become common for many enterprises, it still may be a challenge for others. Nevertheless, other proactive relationships with businesses do seem an important role for the CDO is the public sector. After all, we usually just supply the data, it’s you who makes it interesting.</p>]]></content><author><name>Tom Schenk Jr.</name><email>tomschenkjr@gmail.com</email></author><category term="blog" /><category term="CDO" /><category term="Chicago" /><category term="chief data officer" /><category term="open data" /><category term="open government" /><category term="opendata" /><category term="opengov" /><summary type="html"><![CDATA[Luke Fretwell posted an interesting article on the role CDO has as a business development officer: If I was a Chief Data Officer [...] I would also proactively reach out to these companies to find out what data they’re interested in that government might be able to provide. This could help determine data release schedule/priority or expose low-hanging fruit opportunities and leverage quick wins. Having an established demand also makes it easier to convince internal stakeholders of the value and gives them an incentive to be more proactive in opening the data they manage. Business is one of the key areas targeted by portals. In addition to transparency, promoting civic development, and research, open data as a business development tool has become a more frequent target of open data initiative. The McKinsey report on open data, despite its misgivings, acutely noted the role that opening weather and GPS data had on creating new products in the economy. Like all constituents, requests from start-ups does help gauge the interesting datasets]]></summary></entry><entry><title type="html">Is it really so bad?</title><link href="https://tomschenkjr.github.io/blog/is-it-really-so-bad/" rel="alternate" type="text/html" title="Is it really so bad?" /><published>2015-01-08T01:01:50+00:00</published><updated>2015-01-08T01:01:50+00:00</updated><id>https://tomschenkjr.github.io/blog/is-it-really-so-bad</id><content type="html" xml:base="https://tomschenkjr.github.io/blog/is-it-really-so-bad/"><![CDATA[<p>Stephen Few <a href="http://www.perceptualedge.com/blog/?p=2029">seems to be upset</a>. In his yearly review, he touches on what sees as a year without any progress:</p>
<blockquote><span style="color: #464646;">Since the advent of the computer (and before that the printing press, and before that writing, and before that language), data has always been BIG, and Data Science has existed at least since the time of Kepler. Something did happen last year that is noteworthy, however, but it isn’t praiseworthy: many organizations around the world invested heavily in information technologies that they either don’t need or don’t have the skills to use.</span></blockquote>
<p>The terms “data science” and “big data” have long been debatable, not terms I feel strongly about, either. Somewhere, he misses even his own points:</p>
<blockquote><span style="color: #464646;">Data sensemaking is hard work. It involves intelligence, discipline, and skill. What organizations must do to use data more effectively doesn’t come in a magical product and cannot be expressed as a marketing campaign with a catchy name, such as Big Data or Data Science.</span></blockquote>
<p>Take the assumption that software is overblown and overinvested, the real missing component of research–or “data sensemaking”, because lets replace one made-up word with another–is the lack of human capital. The argument seems to be that the world needs both managers and staff who can wisely invest in analytical software and capable of carrying-out research.</p>

<p>Surely, then, it must be notable the increase in the number of programs focusing on the data analytics. These programs are spreading to nearly every discipline and cross-discipline into new areas.  The University of Chicago’s <a href="https://capp-sites.uchicago.edu/">M.S. in Computational Analysis and Public Policy</a> is designed to train the next generation of researchers in government. If it involves intelligence, discipline, and skill, isn’t the growth of graduate programs a significant factor to raising the number, ubiquity, and quality of analytics that is capable on a day-to-day basis?</p>

<p>Notwithstanding the growth of these programs, the most memorable project from this past year highlights the dangers of blind correlation, a lesson that statistics teachers everywhere to avoid bad statistics. Tyler Vigen’s <a href="http://tylervigen.com/">Spurious Correlations</a> mines data sources to find strong correlations that are meaningless. We’ve been able to systematize and mass-replicate bad analytics that can be highlighted for others. At times, I wish I was teaching again so I can show this site to undergraduate students.</p>

<figure class="align-center">
<a href="http://tylervigen.com/view_correlation?id=1597"><img src="/images/spurious-correlation.png" alt="The spurious correlation between US spending on science, space, and technology correlates with Suicides by hanging, strangulation and suffocation" width="660" height="230" /></a>
<figcaption>The spurious correlation between US spending on science, space, and technology correlates with suicides by hanging, strangulation and suffocation</figcaption>
</figure>

<p>The overuse of phrases like “big data” and “data science” is <a href="https://books.google.com/ngrams/graph?content=big+data%2C+data+science&amp;year_start=1800&amp;year_end=2000&amp;corpus=15&amp;smoothing=3&amp;share=&amp;direct_url=t1%3B%2Cbig%20data%3B%2Cc0%3B.t1%3B%2Cdata%20science%3B%2Cc0">growing quickly</a> and annoyingly. The answer to articles that ask ”Will <em>X</em> be the next big thing?” is usually “no”, the odds are against new things. Even recent articles on how statisticians can “<a href="https://www.google.com/webhp?sourceid=chrome-instant&amp;ion=1&amp;espv=2&amp;ie=UTF-8#safe=off&amp;q=correlation%2C+causation%2C+qz">tell correlation from causation</a>” creates a hype around the discipline that is, well, hype. But it’s important to not be lost in the hype–or the frustration from hype–yourself. To be in this discipline, at this time, is quite noisy.</p>

<p>The term big data is meaningless and often leads to silly debates with no consistent answer. But, it is rather meaningful that we can scale queries horizontally across multiple computers. It’s even more meaningful since it’s quite cheap to do this across virtual machines over the internet–and I remember when <a href="https://www.google.com/search?q=LAN+parties&amp;safe=off&amp;espv=2&amp;biw=1440&amp;bih=828&amp;source=lnms&amp;tbm=isch&amp;sa=X&amp;ei=0COuVPa3B46dyASopIH4DQ&amp;ved=0CAYQ_AUoAQ">LAN parties</a> were fun. Overblown and inaccurate headlines on correlation and causation is frustrating, but it ultimately provides a novel approach on helping parse through large–dare I say, big?–amounts of data. Likewise, the continuing adoption of good programming techniques into code written by statisticians has improved the entire discipline. These practices are spreading and being institutionalized in universities and accelerated training programs.</p>

<p>Calling a year a loss because constant praises of ”big”, “behemoth”, or “slight-larger-than-average” data is succumbing to the same gloss that the marketing gimmicks are selling.</p>]]></content><author><name>Tom Schenk Jr.</name><email>tomschenkjr@gmail.com</email></author><category term="blog" /><category term="big data" /><category term="correlation versus causation" /><category term="data science" /><category term="Statistics" /><category term="University of Chicago" /><summary type="html"><![CDATA[Stephen Few seems to be upset. In his yearly review, he touches on what sees as a year without any progress: Since the advent of the computer (and before that the printing press, and before that writing, and before that language), data has always been BIG, and Data Science has existed at least since the time of Kepler. Something did happen last year that is noteworthy, however, but it isn’t praiseworthy: many organizations around the world invested heavily in information technologies that they either don’t need or don’t have the skills to use. The terms “data science” and “big data” have long been debatable, not terms I feel strongly about, either. Somewhere, he misses even his own points: Data sensemaking is hard work. It involves intelligence, discipline, and skill. What organizations must do to use data more effectively doesn’t come in a magical product and cannot be expressed as a marketing campaign with a catchy name, such as Big Data or Data Science. Take the assumption that software is overblown and overinvested, the real missing component of research–or “data sensemaking”, because lets replace one made-up word with another–is the lack of human capital. The argument seems to be that the world needs both managers and staff who can wisely invest in analytical software and capable of carrying-out research.]]></summary></entry><entry><title type="html">Feedback on FCC Net Neutrality</title><link href="https://tomschenkjr.github.io/blog/feedback-on-fcc-net-neutrality/" rel="alternate" type="text/html" title="Feedback on FCC Net Neutrality" /><published>2014-09-02T23:16:56+00:00</published><updated>2014-09-02T23:16:56+00:00</updated><id>https://tomschenkjr.github.io/blog/feedback-on-fcc-net-neutrality</id><content type="html" xml:base="https://tomschenkjr.github.io/blog/feedback-on-fcc-net-neutrality/"><![CDATA[<p><a href="http://datanouveau.net/post/96517167542/suppose-you-want-feedback-on-an-idea-so-you-offer"><img class="alignnone size-full wp-image-1740" src="/images/datanouveau-sunlight_word-bubble_avaaz.png" alt="datanouveau-sunlight_word-bubble_avaaz" width="908" height="742" /></a></p>

<p>Over at <a href="http://datanouveau.net/post/96517167542/suppose-you-want-feedback-on-an-idea-so-you-offer">Data Nouveau</a>, a highlight of the Sunlight Foundation’s recent analysis and visualization of feedback on over 800,000 comments on the proposed net neutrality rules.</p>]]></content><author><name>Tom Schenk Jr.</name><email>tomschenkjr@gmail.com</email></author><category term="blog" /><category term="Data Visualization" /><category term="net neutrality" /><category term="policy" /><category term="sunlight foundation" /><summary type="html"><![CDATA[]]></summary></entry></feed>